Food inequalities across society
Overview section showed that a huge part of French population was overweight. However we're not all equally likely to be overweight. We have identified three factors that appear to be correlated with weight. Even if we do not display all the statistical background behind this, we've selected only the factors where the trend was statistically significant.
Let's take a closer look onto this situation...
Age
Age appears to be a very good predictor of BMI. If young people are quite unlikely to be overweight, the probability to put on weight seems to increase with age.If you want to have additional information, put your mouse over the boxplots. You can also click on scatterplot, it will make every individual appears (men in blue, women in red), put your mouse over them to know more about them.
Diploma
Interestingly, diploma correlates very well with BMI. The more advanced degree you have, the less likely you are to be overweight.Distribution of the BMI according to the highest diploma got.
Social class
The previous analysis on diploma leads us to expect some similar pattern for social class because the degree you have is a good indicator of the social class you belong to.Distribution of the BMI according to the social class.
- Students are less likely to be overweight than retired people. This is coherent with the age study.
- Working class people suffer more from overweight than middle class ones, which themselves are more likely to be overweight than upper class persons. This is consistent with the analysis of diploma. By exploring the scatterplot you can see that diploma is a good indicator of social class. This is also in line with previous studies that have shown that upper class people often have healthier food habits.
Other inequalities
Beyond BMI, there are other parameters which enable us to observe inequalities across the social classes. Many crucial nutrients such as vitamin C are insufficiently consumed by a part of the population, as shown on the graph below.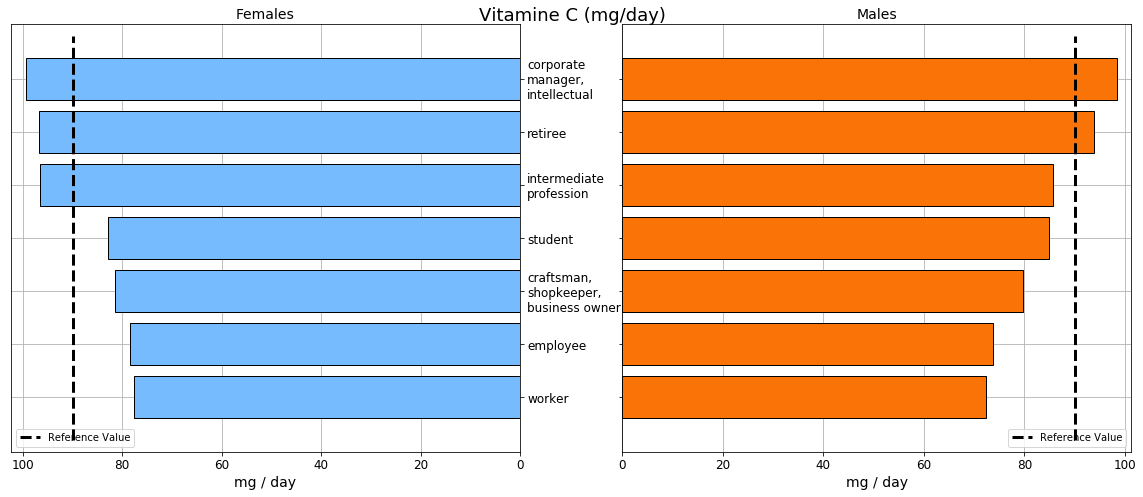
The case of vitamin C is self-speaking. As so often, the classes under the recommended intakes are the students and the lower classes. Moreover, even slight lacks in this vitamin can have an impact on health: headaches, bone pains, greater vulnerability to infections... And it is a nutrient that is found in specific fruits and vegetables (red fruits, bell pepper, miscellaneous exotic fruits), whose consumption is, as we will see later, an other marker of inequalities. Eventually, vitamin C is also known by the general public as an usual dietary supplement, which are also an issue, being expensive and sometimes incorrectly used.